
Page 18 - Appetite_Stimulation_In_Dogs_Complete
P. 18
Efficacy of a ghrelin-agonist in dogs 3
treatment group. Possible differences between treatment groups
Blood collection
were evaluated using analysis of variance modeling with treat-
Blood was collected on days 1, 4, 7, and 9 for drug and hor- ment group as effect. Pairwise comparison for each of the
mone concentration analyses. On days 1, 4, and 7, blood sam- groups 2, 3, and 4 to Group 1 (placebo) was derived from this
ples (3–4 mL) were collected from the jugular or, if necessary, model. Statistical significance was defined as P ≤ 0.05. All
â e
another accessible vein in a standard serum collection tube analyses were performed using SAS version 9.3.
with a gel separator and clot activator b at approximately
15 min prior to dosing, then at dosing (time 0; just prior to
RESULTS
dosing) and 30, 45, 60, 90, 120, 240, 360, and 480 min
postdose. On Day 9, one blood sample was collected at time 0
Clinical observations
(approximately 8 am). Samples were allowed to clot and then
centrifuged within 0.5–2 h postcollection in a refrigerated cen- The capromorelin and placebo oral solutions appeared to be
trifuge. At that time, 0.5-mL aliquots of serum were transferred well tolerated. Two dogs each had one observed soft stool on
to 1-mL cryovials using a plastic pipette. The cryovials of Day 7 (groups 2 and 4). One dog in Group 2 had a soft stool
serum were stored frozen ( 60 to 80 °C) until packaged on on Day 4. Two dogs in Group 2 displayed some degree of
dry ice for shipping to the analytical laboratories. Serum sam- lethargy postdosing on Day 1. A number of dogs across the
ples were analyzed for capromorelin, GH, IGF-1, and cortisol. capromorelin treatment groups and study days exhibited exces-
sive salivation at the time of dosing. One dog in Group 2 dis-
played excessive salivation at 30 min postdose on days 1, 4,
Serum capromorelin, GH, IGF-1, and cortisol measurements
and 7.
Serum capromorelin concentrations were analyzed using a val-
c
idated HPLC–MS/MS method. Capromorelin was measured in
Food consumption
serum samples collected on days 1 and 7 at time points 0, 30,
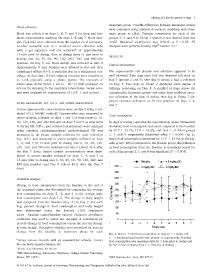
60, 120, 240, and 480 min and on days 4 and 9 at time point In dogs receiving capromorelin oral solution, mean ( standard
0. Serum GH, IGF-1, and cortisol concentrations were analyzed deviation) food consumption increased compared to the baseline
using validated radioimmunoassay methodologiesd GH was by 57.7 35.1%, 37.9 16.8%, and 36.4 21.4% in groups
measured in all serum samples collected for each collection 2, 3, and 4, respectively (treatment effect P < 0.005; Fig. 2).
day. IGF-1 was measured in serum samples collected on days Mean food consumption decreased by 13.5 14.9% in the pla-
1, 4, and 7 at 15 min prior to dosing and 0, 30, 60, 120, cebo group. When compared to the placebo group, the difference
240, 360, and 480 min postdose and Day 9 (about 48 h after in food consumption from the baseline to treatment period for
the Day 7 dose). Serum cortisol concentrations were deter- each of the groups 2, 3, and 4 was significant (P < 0.005).
mined in serum samples collected on days 1, 4, and 7 at
15 min prior to dosing and 0, 30, 45, 60, 90, 120, 240, and
480 min postdose and Day 9 (about 48 h after the Day 7
dose).
Statistical analyses
Change in food consumption from the baseline to the end of
the treatment phase was determined by comparing the average
food consumption on days -3, -2, and -1 to the average daily
food consumption over days 1–7. The change in body weight
was compared from the baseline (Day -1) to Day 7. For each
dog, percent change in food consumption and body weight
was determined using the formula [100 (treatment
value - baseline value)/baseline value)]. Pearson’s correlation
coefficient was used to assess the strength of correlation for
percent change in food consumption versus the percent change
in body weight. Descriptive statistics were presented for percent
change from the baseline to treatment phase for each
Fig. 2. Mean ( SD) food consumption in dogs (n = 3 males and
n = 3 females/group) treated with placebo or capromorelin. Baseline
b
Greiner Bio-one Vacuette with gel separator/clot activator. Greiner
food consumption was measured daily for 3 days prior to dosing and
Bio-one North America; Monroe, NC for the 7 days of dosing (Day 1 = first day of dosing).
c
KCAS, LLC; Shawnee, KS 66216
d
HDC Endocrinology Laboratory Veterinary College Cornell University;
Ithaca, NY 14853. e SAS Institute Inc., Cary, NC 27513
© 2016 The Authors. Journal of Veterinary Pharmacology and Therapeutics Published by John Wiley & Sons Ltd