
Page 189 - Raw Diet References Book 2019
P. 189
Proposed Revisions Edited per Comments for 2014 Official Publication 22
Regulation PF9. After determining the energy density of the food, the nutrient values
can be converted to a per 4000 kcal ME/kg DM or a per 1000 kcal ME basis and
compared to the values in the appropriate AAFCO Nutrient Profile.
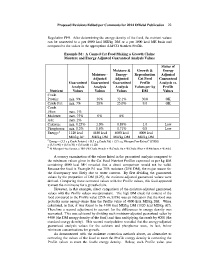
Example B1: A Canned Cat Food Making a Growth Claim:
Moisture and Energy Adjusted Guaranteed Analysis Values
Status of
Moisture & Growth & Energy
Moisture - Energy- Reproduction Adjusted
Adjusted Adjusted Cat Food Guaranteed
Guaranteed Guaranteed Guaranteed Profile Analysis vs.
Analysis Analysis Analysis Values per kg Profile
Nutrient Values Values Values DM Values
Crude
Protein: min. 9% 36% 32.1% 30.0 OK
Crude Fat: min. 7% 28% 25.0% 9.0 OK
Crude
Fiber: max. 1%
Moisture: max. 75% 0% 0%
Ash: max. 2%
Calcium: min. 0.25% 1.0% 0.89% 1.0 Low
Phosphorus: min. 0.2% 0.8% 0.71% 0.8 Low
a
Energy: 1120 kcal 4480 kcal 4000 kcal 4000 kcal
ME/kg AF ME/kg DM ME/kg DM ME/kg DM
a b
Energy = (3.5 x g Crude Protein) + (8.5 x g Crude Fat) + (3.5 x g Nitrogen Free Extract (CHO))
= (3.5 x 90) + (8.5 x 70) + (3.5 x 60) = 1120
b
% Nitrogen Free Extract = 100- (% Crude Protein + % Crude Fat + % Crude Fiber + % Moisture + % Ash)
A cursory examination of the values listed in the guaranteed analysis compared to
the minimum values given in the Cat Food Nutrient Profiles expressed as per kg DM
containing 4000 kcal ME revealed that a direct comparison would not be valid.
Because the food in Example B1 was 75% moisture (25% DM), the major reason for
the discrepancy was likely due to water content. By first dividing the guaranteed
values by the proportion of DM (0.25), the moisture-adjusted guaranteed values were
derived. Comparing these corrected values with the Profile values, this food appeared
to meet the minimums for a growth claim.
However, in this example, direct comparison of the moisture-adjusted guaranteed
values with the Profile values was premature. The high DM crude fat content of the
food compared to the Profile value (25% vs. 9.0%) was an indication that the food was
probably more energy-dense than the Profile value of 4000 kcal ME/kg DM. When
calculated, in fact, it was found to be 4480 kcal ME/kg DM (1120 kcal ME/kg AF).
Therefore a second adjustment to account for the differences in energy density was
warranted. This was achieved by dividing each moisture-adjusted guaranteed value by
4480 (the DM energy density of the food) and then multiplying the result by 4000 (the
standard energy density). This second manipulation revealed that the energy-adjusted
guaranteed analysis values for the calcium and phosphorus were, in fact, below
minimum concentrations for growth.
As demonstrated with the moisture correction methods above, an alternative to
correcting the values of the food to meet the Profile energy density is correcting the
Profile values to meet the food's energy density. Below, each Profile value was