
Page 26 - Appetite_Stimulation_In_Dogs_Complete
P. 26
1854 Zollers et al
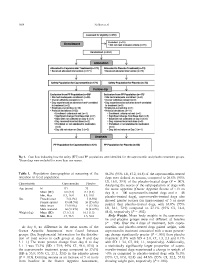
Fig 1. Case flow indicating how the safety (ITT) and PP populations were identified for the capromorelin and placebo treatment groups.
*Some dogs were excluded for more than one reason.
Table 1. Population demographics at screening of the 56.2% (95% CI, 47.2, 64.8) of the capromorelin-treated
intention to treat population. dogs were defined as success, compared to 26.8% (95%
CI, 16.8, 39.9) of the placebo-treated dogs (P = .007).
Characteristic Capromorelin Placebo
Analyzing the scores of the subpopulation of dogs with
Age (years) N 171 73 the worst appetites (Owner Appetite Scores of <13 on
Mean (SD) 8.0 (4.4) 8.1 (4.4) day 0; n = 100 capromorelin-treated dogs and n = 48
Min, Max 0.3, 16.4 0.9, 18.0 placebo-treated dogs), capromorelin-treated dogs also
Sex Female intact 7 (4.1%) 5 (6.8%) showed greater success (an improvement of 5 or more
Female spayed 83 (48.5%) 26 (35.6%)
Male intact 17 (9.9%) 9 (12.3%) points) than placebo-treated dogs, with 64.0% (95%
Male neutered 64 (37.4%) 32 (43.8%) CI, 54.1, 72.9) compared to 27.1% (95% CI, 16.4,
Weight (kg) Mean (SD) 17.1 (1.1) 16.3 (1.5) 41.4), respectively (P = .002).
Min, Max 1.7, 76.5 1.5, 52.2 Body Weight. Mean body weights in the capromore-
lin and placebo groups were not different at baseline
(P = .794). Over the 4 days of treatment, both capro-
At day 0, no difference in the mean scores of the morelin- and placebo-treated dogs gained weight, with
Owner Appetite Assessment were found between capromorelin treatment associated with a mean percent-
groups. (See Supplemental Information for the distribu- age change significantly greater (P < .001) than placebo
tion of total scores in each group at day 0 and day treatment (1.8% with SD 2.8, CI, 1.3, 2.3 and 0.1%
3 1.) The mean percent change from day 0 to day with SD 3.6, CI, 0.9, 1.1, respectively). Additionally,
3 1 was 73.3% (SD 75.9; 95% CI, 59.6, 87.0) in a statistically significantly larger proportion of capro-
the capromorelin treatment group compared to 37.6% morelin-treated dogs experienced a change in weight of
(SD 53.9; 95% CI, 23.1, 52.0) in the placebo group >0% as compared to placebo-treated dogs with 76.0%
(P = .013). Defining success as an increase of 5 or more (95% CI, 67.6, 82.8) and 44.6% (95% CI, 32.2, 57.8)
from baseline in the Owner Appetite Assessment, showing weight gain, respectively (P = .001).